Use of Pivot Table in MS-Excel
Pivot table is one of the most important and useful feature
of MS Excel. Normally pivot table is used for Zonal sale analysis or such kind
of other analysis where you have to analyze the thing category wise. Let’s have
an example, where we are assuming that 24 Managers of an electronic company are
posted at 24 different cities of India. And we have selected these cities
according to four zones i.e. North, East, South and West.
 |
| From pivot |
First step to prepare Pivot table is to select data from A1
to I25
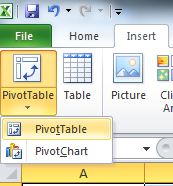
Next step is to click on Insert --> Pivot Table --> Pivot Table
 |
| From pivot |
The following dialog box will appear on the screen:
 |
| From pivot |
If you have not selected the range from A1 to A25 then you
can select the range by clicking the red-arrow. Just press OK to get Pivot
table on new worksheet. The Pivot table will appear on new worksheet :
 |
| From pivot |
On the right side of excel screen there is field list. Now
Just by clicking on Zone and Total we can get the total zone wise sales.
 |
| From pivot |
By this way we can click on Manager-Total, State-TV, Zone-WM
etc. This way Pivot table give us freedom to revolve our different analysis
around few clicks.


0 comments:
Post a Comment